Exploring Brain Connectivity Through Topological Data Analysis
Written on
Chapter 1: Introduction to Topological Data Analysis
Topological Data Analysis (TDA) is an innovative approach that goes beyond simple pairwise assessments of brain connectivity. This method is gaining traction in the field of neuroscience for its ability to illustrate complex relationships within brain networks.

The GUDHI library, which stands for Geometry Understanding in Higher Dimensions, serves as an open-source tool for computational topology and TDA. Developed by an INRIA unit, GUDHI offers a variety of algorithms for constructing different types of simplicial complexes and provides data structures for their representation. Written in C++ and wrapped in Python via Cython, GUDHI is particularly useful in analyzing interconnected graphs found in various natural data structures. TDA has emerged from applied algebraic topology and computational geometry and has become essential in understanding the brain's connectome.
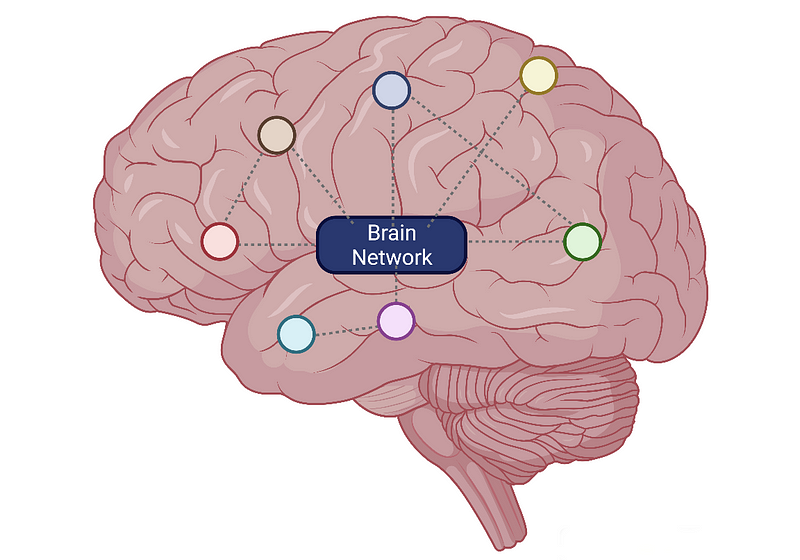
Section 1.1: Understanding the Connectome
A connectome is essentially a graph that represents the brain, with each node symbolizing a specific brain region and edges illustrating either structural connections or correlations in brain activity. The former is referred to as the structural connectome, while the latter is known as the functional connectome.
This representation has been instrumental for thousands of researchers seeking to uncover biomarkers or delve into intrinsic brain characteristics. It allows for the identification of local network variations and the application of metrics that summarize crucial aspects of networks, such as segregation and integration. However, to capture more complex interactions between brain regions, it is necessary to transition from basic pairwise metrics to simplicial complexes.
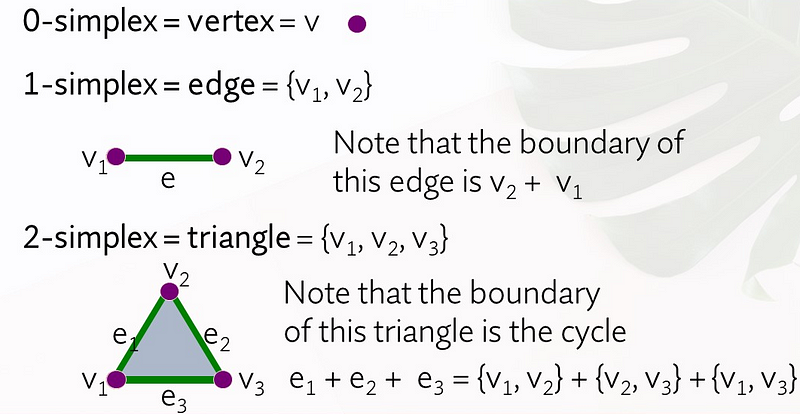
Section 1.2: What Are Simplicial Complexes?
A simplicial complex consists of points, line segments, triangles, and their higher-dimensional counterparts. Specifically, a 0-simplex is a vertex, a 1-simplex is an edge connecting two nodes, and a 2-simplex is a triangle.
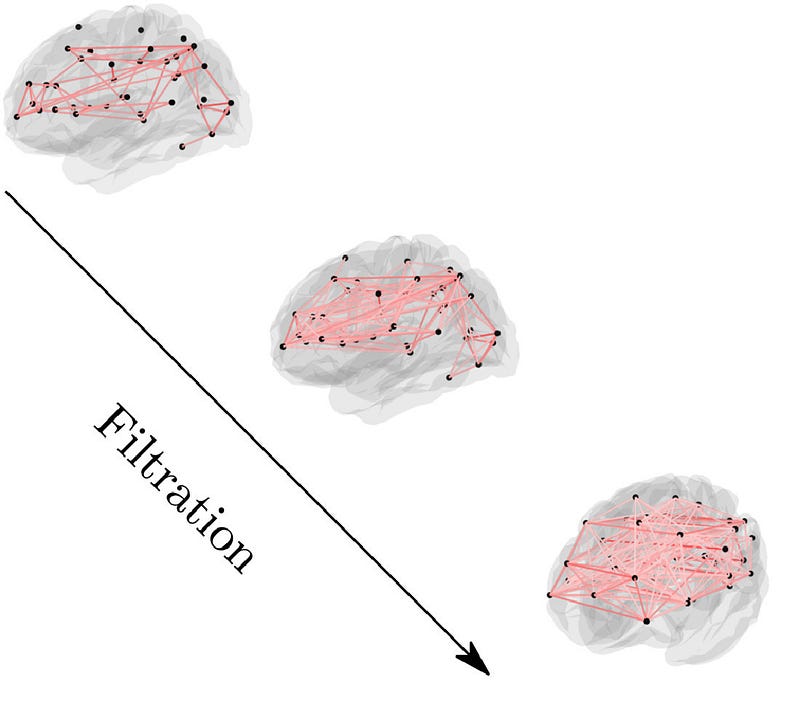
Persistent homology is a pivotal technique for determining the topological properties of a space, particularly in the context of networks. This method tracks the emergence of cycles throughout various stages of filtration in the evolving simplicial complexes.
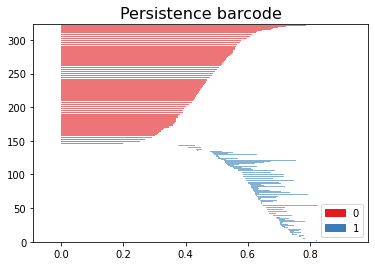
More formally, this process is illustrated by a persistence diagram, which visualizes the persistence of homology classes.
Assuming the brain connectome is represented as an adjacency matrix, the following code can generate the aforementioned graph:
import gudhi
import numpy as np
matrix = np.genfromtxt('Connectome.txt')
mattop = 1 - matrix # Computing and plotting barcode
rips_complex = gudhi.RipsComplex(distance_matrix=mattop, max_edge_length=1)
simplex_tree = rips_complex.create_simplex_tree(max_dimension=2)
diag = simplex_tree.persistence()
gudhi.plot_persistence_barcode(diag, legend=True, max_intervals=0)
When working with correlation matrices derived from functional connectivity or structural connectivity, it’s crucial to convert all data into distance formats. Other significant topological metrics include the Betti number, Euler characteristics, and curvature. The Betti number counts the number of k-dimensional holes in a simplicial complex, while Euler characteristics are calculated using the formula ( V - E + F ), where V, E, and F represent the counts of vertices, edges, and faces, respectively.
Chapter 2: Visualizing Brain Connectivity
Obtaining and visualizing TDA metrics can provide invaluable insights into brain connectivity. While various tools exist for this purpose, visualization software like Matlab's BrainNetViewer and the Brainnetome Toolkit are frequently employed. In more recent developments, Nilearn and Plotly have emerged as powerful alternatives for visualizing brain networks.
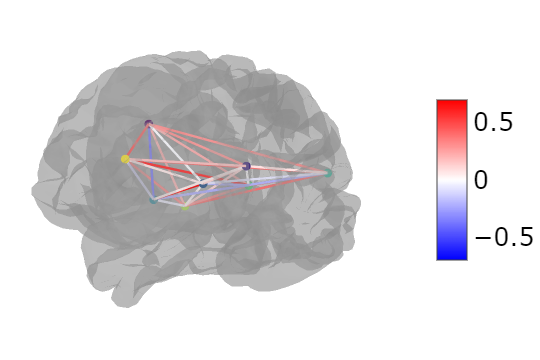
Utilizing Nilearn, you can create a glass brain visualization that highlights the connectivity values. Here is a sample code that demonstrates how to achieve this, assuming you have the node coordinates from a brain atlas and the connectivity values in a matrix format:
import pandas as pd
from nilearn import plotting
# Brain atlas centroids
coords = pd.read_csv("coords.txt", header=None)
# Adjacency matrix (brain connectivity)
connectome = pd.read_csv("Conn_mat.txt", header=None)
plotting.view_connectome(connectome.values, coords.values, linewidth=5.0, node_size=5.0)
Alternatively, with Plotly, you can overlay a 3D graph on a brain mesh, as shown in the following code snippet:
import meshio
import plotly.graph_objs as go
path_brainobj = "brain.stl"
mesh_data = meshio.read(path_brainobj)
fig = go.Figure()
fig.add_trace(go.Mesh3d(
x=mesh_data.points[:,0],
y=mesh_data.points[:, 1],
z=mesh_data.points[:, 2],
i=mesh_data.cells[0].data[:, 0],
j=mesh_data.cells[0].data[:, 1],
k=mesh_data.cells[0].data[:, 2],
intensity=mesh_data.points[:, 2],
colorscale='Viridis'
))
fig.show()
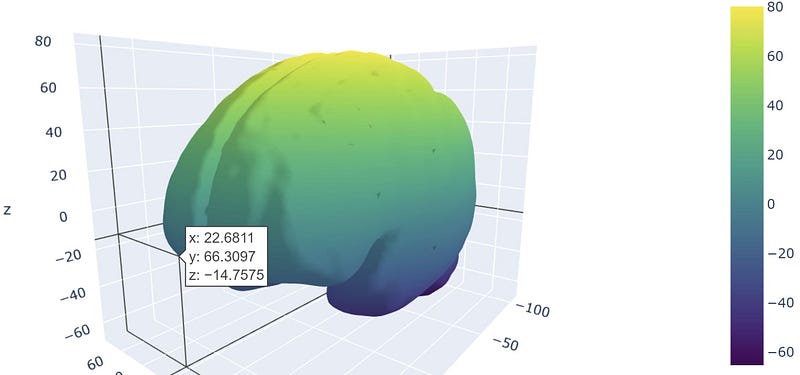
With these tools, researchers can plot both pairwise connectivity metrics and complex features derived from simplicial complexes. Plotly allows for multiple elements to be displayed simultaneously, enhancing the visualization experience.
Conclusions
TDA offers a sophisticated toolkit for analyzing data and developing new biomarkers, capturing higher-order interactions among brain network nodes. The utility of these measures remains to be fully validated. Historically, it has been suggested that many brain network metrics could be distilled to basic degree analyses, with additional measures serving more decorative purposes.
From a visualization standpoint, specialized tools designed for network neuroscience may be more user-friendly than broader platforms like Plotly. However, given the increasing interest in machine learning technologies such as Scikit-learn, Scikit-TDA, and Tensorflow, integrated visualization methods like those provided by Nilearn or Plotly will be beneficial, especially for those with coding expertise.